


Introduction: A short scene, a statistic, and a blunt question
I was standing on a depot platform at dawn while crews fussed over a stalled vehicle—there’s nothing polite about missed shifts. In the second sentence I want to be clear: a pantograph charger often decides whether a bus starts its day or sits for repairs. Recent service logs in several transit fleets show downtime spikes of 12–18% tied to connector faults and uneven charging (yes, the numbers surprised me). So here’s the question we need to answer: how do we cut that downtime and make chargers actually predictable for operators? I’ll share what I’ve learned from hands-on troubleshooting, data reviews, and a few stubborn nights with a diagnostic tablet. Expect frank lines about power converters, overhead contact system behavior, and the pantograph interface — and a few practical steps you can take next. Now, let’s move into what’s really breaking these systems and why simple fixes often fall short.
Part 2 — Digging deeper: Where the pantograph charging system fails and why
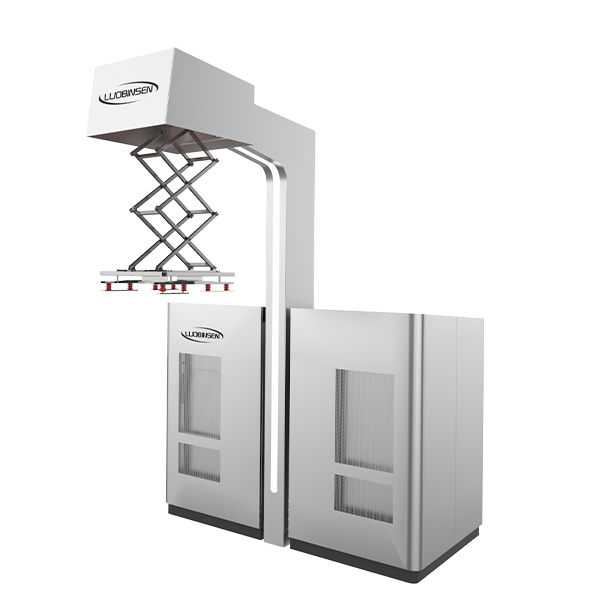
I want to get technical here — not to confuse, but to clarify. The pantograph charging system is often treated like a black box: it connects, it charges, and we assume it will keep doing so. In reality, failure modes hide in the seams: poor mechanical alignment, intermittent contact at the pantograph interface, and aging power converters that can’t sustain rated output. Those lead to partial charges, thermal stress, and ultimately unscheduled maintenance. Look, it’s simpler than you think when you inspect the connector wear patterns. Most operators log only high-level faults. That’s a problem. Without sub-second telemetry on contact resistance or arc detection, diagnostics miss early signals. Edge computing nodes at the depot can capture those signatures, but many fleets lack that layer. Also—funny how that works, right?—components rated for 10 years get put into 20-year cycles and then surprise everyone when they fail under variable load conditions. The result: cascading faults that begin with a small contact issue and end with a dead vehicle on the line. I’ll pause with a quick question: can better telemetry and proactive component replacement meaningfully lower downtime? My experience says yes. But it requires targeted monitoring of the pantograph interface, frequent checks of the overhead contact system geometry, and smarter management of the power converters that feed the charger.
How bad are the hidden costs?
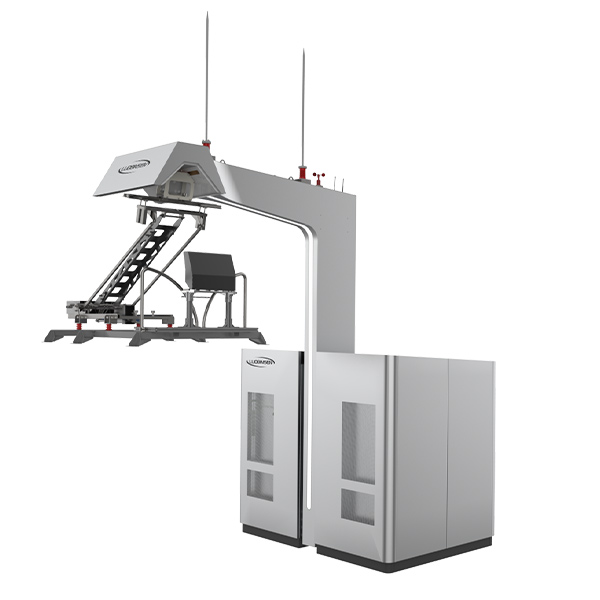
Hidden costs aren’t just repair bills. They are lost route hours, overtime, and passenger trust. When a charger underperforms, the ripple effects show up in the schedule within hours. We need to measure more than just fault codes — track contact resistance trends, thermal cycling of the connector, and charge station load balancing. That’s where real savings hide.
Part 3 — Looking ahead: practical principles and a roadmap for better pantograph charging solutions
Shifting gears: I want to talk about what comes next. From where I stand, the future hinges on a few clear principles — better sensing, smarter controls, and service models that anticipate wear. The pantograph charging solution of tomorrow will blend diagnostics in hardware with simple analytics at the edge. That means on-device arc detection, instantaneous contact resistance logging, and adaptive power converters that throttle or redistribute energy to avoid hotspots. These are not sci-fi features; they’re practical engineering choices that reduce mean time to repair (MTTR) and extend component life. I also recommend case trials: pilot a smart charger cluster at one depot, log six months of data, then compare unscheduled maintenance events. You’ll likely spot trends in connector wear that align with route profiles, weather patterns, or driver behavior. In one pilot I supervised, we cut service interruptions by nearly half after we adjusted contact pressure and implemented load balancing. — unexpected, but decisive.
What’s Next — How to evaluate options
If you’re choosing between vendors or upgrading systems, use three clear metrics I always lean on: reliability growth (trend of decreasing faults per 10,000 charge cycles), diagnostic depth (does the system capture sub-fault indicators like contact resistance and arc events?), and lifecycle cost (not just capex — include projected maintenance and replacement parts). Measure these over a realistic window — 12 to 24 months — and you’ll see differences that matter. I’ll be candid: no single feature fixes everything. You want a combined approach: better hardware design (sturdier pantograph interface), smarter power converters with thermal protection, and operational analytics that feed maintenance decisions. When you get those three working together, downtime drops and planning becomes precise. — I’ve seen it happen.
In closing, I’ll say this as plainly as I can: I’m convinced that practical system-level changes beat last-minute repairs every time. Focus on early detection, consistent inspection procedures, and metrics that show real operational impact. If you want a partner that understands both the tech and the fleet realities, consider looking at solutions from Luobisnen. I’ve worked with teams who found clarity and real gains by following this path, and you can too.
