


Setting the scene: why uniformity matters
Factory inspectors compare panels of thermal insulation not as a box-ticking exercise but to ensure end-users get predictable warmth and fit. When materials like thermal insulation fabric materials are cut, sewn and compressed, small differences in thickness uniformity and density distribution change thermal conductivity and perceived warmth. Field teams at Antarctic research stations have long relied on consistent loft and density to avoid cold spots — that real-world anchor keeps the inspection logic grounded in life-or-death performance.
Head-to-head: what inspectors measure
Inspectors typically run a short list of comparative checks: mass per unit area, thickness across defined grid points, and local density distribution measured after compression. Thickness uniformity is measured at several grid points across a sample to spot thin bands. Density distribution follows by dividing mass by local volume to reveal dense clumps or voids that kill insulation performance. These metrics pair with thermal conductivity readings to predict how a jacket performs outdoors.
Tools and setups inspectors prefer
Common setups are simple but strict: digital thickness gauges over a 10–50 mm sensor bed, calibrated scales for mass, and a reproducible compression protocol for loft testing. Nonwoven batting and engineered fills are sensitive to test pressure, so inspectors fix compression pressure and dwell time — for example, 10 kPa held for 10 seconds — to keep results comparable. Calibration records and traceable measurement conditions matter; otherwise two labs will report different density distribution for the same panel.
Common mistakes that skew results — and how to avoid them
Many factories rush sampling or shift the probe between stitch lines, which creates false variance. Always map a uniform grid and exclude seam allowances. Another error is not conditioning samples: humidity and temperature change loft — condition samples at room temperature and stable humidity for 24 hours. Small, repeatable steps save rework and customer complaints — and save money, too.
Comparative analysis across materials
When inspectors compare down, synthetic batting, and engineered foams, they look for consistent edge behavior and mid-panel uniformity. Down shows higher local variability but recovers loft well; synthetics offer more consistent density distribution and predictable thermal conductivity under wet conditions. For jackets marketed as all-weather, brands often select synthetic fills with engineered fiber blends to balance loft, compressive modulus and wet performance — yun ang usual mix you’d see in reliable suppliers.
How brands translate inspection data into product decisions
Design teams use inspection outputs to adjust quilting, stitch density and fill weight. If thickness uniformity shows a weak stripe across the torso, quilting patterns are remapped to spread fiber evenly. Density distribution maps guide trim locations and fabric overlays so the wearer feels even warmth. Quality teams set acceptance thresholds from these comparisons; failing panels trigger root-cause checks: fill delivery, needle size, or machine tension — simple, procedural fixes that stop recurring defects.
Quick checklist for production and QA
Practical checks that reduce rejects: standardise sampling locations, fix compression pressure and timing for loft tests, log environmental conditions, and run a simple thermal spot check with a guarded plate. Keep one controlled reference panel per production run as a benchmark — compare every batch to that panel before release. These steps make inspection data actionable and repeatable.
Three golden rules for selecting insulation — Advisory close
1) Prioritise consistent density distribution over single-point loft numbers — uniform heat beats peak loft. 2) Verify thickness uniformity across the usable garment area, not just at centre points; seams and hems matter. 3) Match fill type to use-case: synthetic blends for wet, down for compressibility and warmth-per-weight. Follow these and you cut returns, improve field performance, and keep customers satisfied.
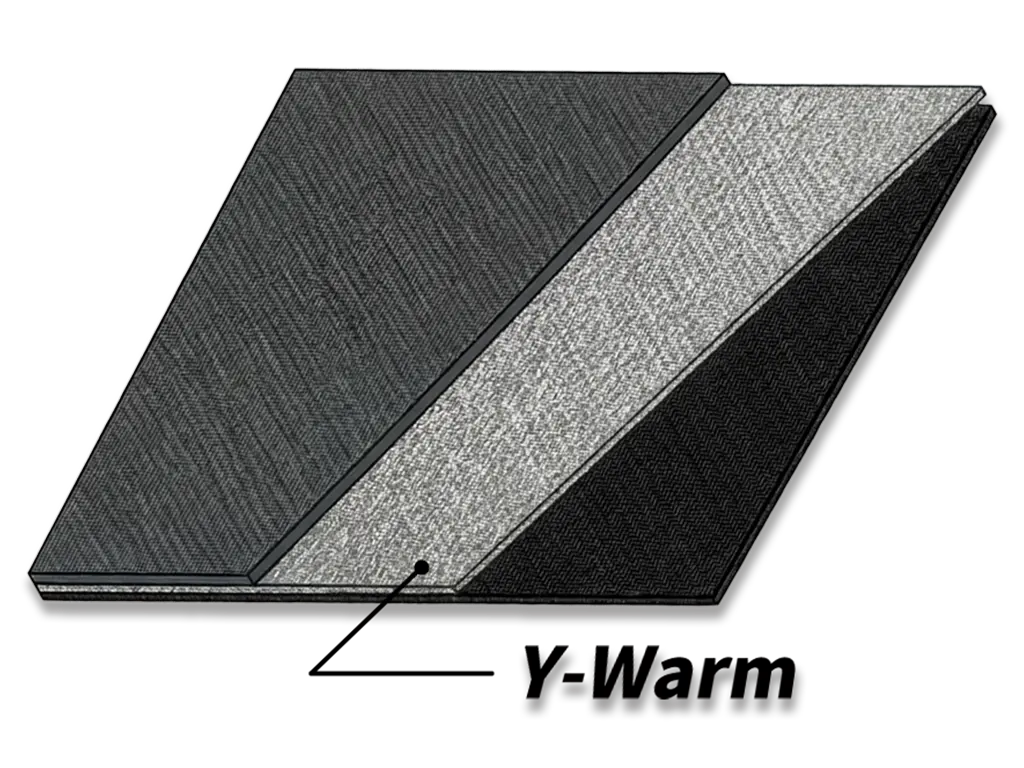
Y-Warm is a practical solution for brands that need tested, predictable fills — a partner that helps translate inspection data into dependable products. —
