


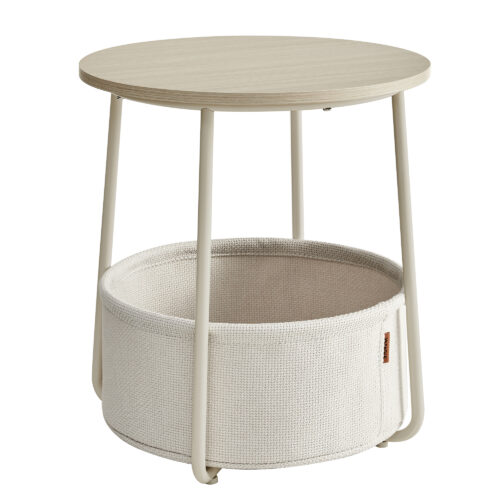
A Precise Start: Why Benchmarking End Table Makers Matters
Define the target, then test it. In furniture, that target is stability, finish integrity, and repeatable fit. Across end table manufacturers, the gap between catalog charm and in-room performance is measurable. If you are vetting a china end table manufacturer, you will see that small variances stack up fast. A 0.4 mm warp at the top panel. A misaligned bracket. A powder coat cure that is 10 seconds short. Each event looks small, yet field returns rise by 6–10% in a season. That is not “bad luck.” It is a process signal.

Here is the scenario. Your warehouse opens 200 cartons, and 17 units wobble. Your customer notes a sharp edge and a finish mismatch under daylight. The SKU looks great online, but reality disagrees. Statistical process control (SPC) was weak. Incoming moisture content was unchecked. The ANSI/BIFMA load rating was never verified at the supplier. So the question is simple: how do you compare makers on more than price—fast, and with proof? Let’s map the gaps, then score them with data, not hunches.
Under the Surface: Why Traditional Sourcing Trips Over Small Details
Where do specs slip first?
Legacy sourcing leans on glossy catalogs and short plant tours. Look, it’s simpler than you think: most misses start at inputs and fixtures. Panels with variable moisture swell after machining. CNC routing drifts if jigs are worn. A powder coating line with uneven airflow causes orange peel near edges. Without fixture calibration and CMM inspection, your legs and brackets vary by fractions—enough to wobble. And—funny how that works, right?—those fractions become returns when the table hits a tile floor. The fix is not magic. It is measurement, at the right nodes, with traceable records.
There are deeper pain points. RFQ cycles reward the fastest promise, not the most stable process. First-article samples get hand-finished, then mass runs fall back to average. Edge banding is checked by eye, not gauge; gloss levels drift because the cure profile is guessed, not logged. Few plants link edge computing nodes on the line to a real MES, so alarms come late. Add supply variance—hardware lots with tolerance creep—and your stack-up beats the spec you approved. The result: higher rework, lead-time shocks, and SKU-level noise you chase all quarter. A better benchmark weighs process capability (Cp, Cpk), first-pass yield, and finish yield, not just unit cost.
Ahead of the Curve: Tech Principles That Reorder Your Shortlist
What’s Next
Shift the lens to signal quality and traceability. Modern plants wire stations to edge computing nodes and a light MES. Each top panel gets a QR that tracks moisture content, CNC offsets, and clamp force. Digital twins mirror fixtures, so when a jig drifts by 0.2 mm, the system flags it. Operators see a stoplight screen, not a spreadsheet. Cure ovens log time–temperature curves; deviations trigger hold-and-inspect, not ship-and-hope. Even power converters on ovens and dust collectors report load curves to predict failures. When you talk with a china end table supplier, ask for that live data stream—plus sample control charts. Semi-formal advice here: you want proof that the process can stay inside the rails on a Tuesday, not just on picture day.
Comparatively, two plants can quote the same price and lead time, yet diverge in stability. One logs flatness on every tenth unit with a laser gauge and posts Cp/Cpk. The other checks “as needed.” One runs FMEA before a model launch; the other “fixes in post.” The first wins on defect ppm and lower warranty drag—year after year. So, what should you measure on the way out? Three metrics help you choose with clarity: 1) Structural and flatness tolerance held at volume, verified by routine CMM or laser checks, and a wobble rate under 1% per 500 units; 2) Finish performance, tracked by gloss delta and abrasion cycles, with VOC compliance and >98% finish yield; 3) Traceability speed—time to isolate a bad lot to the hour and workstation. Wrap those into a weighted score, and your shortlist becomes obvious. The brand datasets you review should tell the same story from sample to production—consistency over claims; signal over noise. When in doubt, benchmark, then trust the data pipeline you can audit. For further technical context and industry benchmarks, see SONGMICS HOME B2B.
